Whether to completing a business plan (for investors’ review) or just doing a rough feasibility of a small business model, calculating and analyzing break-even point is always worth the works and time it takes. In business’s people lingo, your break-even point is the amount of income you’ll need to cover your expenses before you make a dime of profit. Expenses include the costs of making your product or service (also known as variable costs, I will explain in detail later), plus your overhead, like rent, salaries and utility bills (commonly called fixed costs).
The title of this post says, “Break-Even Point Calculation and Analysis For Business People” does not mean that break-even analysis for business people and accountant is different. It is the same, but the way how to see and understand it maybe different. In this post, I explain it in greater detail but the simple way, less accounting jargons plus some suggestion for business people… and no Break-even graphicIf you’re an accountant or accounting student, it is good that you can see how break-even analysis applied in real business. I hope it is helpful for everyone. Enjoy!
Since break-even analysis offers a glimpse of your ultimate profitability, it’s a great tool for weeding out losing business ideas. For example, if you see that you’ll need to achieve a highly optimistic sales number just to cover your costs, you’ll probably want to rethink your entire business plan. Maybe there will be a way you can adjust parts of your business so that a more reachable sales volume will result in a profit. If not, it might be best to ditch your less-than-brilliant business idea.
In a nutshell, to calculate and analyze break-even point, you’ll need to go to carry on the following five steps, and I will take you through:
- Step-1. Estimate Your Sales Revenue
- Step-2. Calculate Your Average Gross Profit Percentage
- Step-3. Estimate Your Fixed Costs
- Step-4. Calculate Your Break-Even Point
- Step-5. Analyze Your Break-Even Point
Before I go into the details of calculating and analyzing your break-even point, let’s look at a super simplified case example to illustrate the overall process (Note: All the calculations are explained in more detail after the case example below; for now, just focus on the process as a whole).
Break-even Point Analysis (Super Simplified Case Example)
Stacey is starting a business selling her own handmade jewelry. To calculate her break-even point, she would make her very best estimate of how much jewelry she thinks she could sell in a year. She figures she could sell an average of 20 pieces a month at $20 apiece, making her yearly income $4,800.Then she’d figure out how much she’d make on each sale, above the cost of materials. (For this super-simplified example, let’s leave the cost of her time out of the equation.) Since the materials for each piece cost Stacey $5, she’d be making $15 on each sale. In other words, her gross profit would be $15 per piece.Next she would calculate her gross profit percentage, which is her gross profit ($15) divided by her selling price ($20). This puts her gross profit percentage at 75%, which means that 0.75 of each sales dollar exceeds of the cost of the piece of jewelry itself.Next Stacey would figure out what her fixed costs would be—say the cost of her tools, and the monthly cost of her booth at a local arts and crafts mall. She figures that these fixed costs total $50 per month, or $600 per year.To calculate her break-even point, Stacey will divide her annual fixed costs ($600) by her gross profit percentage (0.75) to arrive at a break-even point of $800. This means that just to cover the costs of the materials, and her tools and booth, Stacey must bring in $800 per year, and anything above that amount will be her pre-tax profit. Since she earlier estimated that she could sell $4,800 worth of jewelry per year, Stacey figures that she’ll easily reach her break-even point—and make a healthy profit as well.
There are two important tasks you would need to understand before actually crunching your numbers for the break-even point: making financial estimates and categorizing your expenses as I explain below:
1. Making Financial Estimates – When you estimate your income and expenses, your estimates should extend over enough time to catch up with seasonal fluctuations. Depending on your type of business, your revenue and expenses may vary wildly from month to month. For example, if you plan to manufacture custom snowboards, most of your sales will be in late fall and early winter months, while the opposite would be true if you made surfboards. A good way to account for this is to make estimates for each month of the year, then add them up to get a yearly figure. I recommend covering at least a one-year period, which is enough time to account for normal ups-and-downs, but not so long as to maybe overly speculative.
2. Categorizing Your Expenses – Your business expenses need to be divided into two categories: fixed expenses (fixed costs) and variable expenses (variable costs). This division not only is important for your break-even analysis, it’s a standard method of categorizing expenses for accounting and tax reporting. Understanding the difference is your key. Here they are:
- Variable costs - These costs—sometimes also called product costs, costs of goods or costs of sale—are directly related to the products or services you provide and include inventory, packaging, supplies, materials and sometimes labor used in providing your product or service. They’re called “variable” precisely because they go up or down depending on the volume of products or services you produce or sell. (In the case of services, one of the biggest variable expenses is almost always the wages or salary of the service provider.
- Fixed costs - Commonly referred to as “overhead,” these include all regular expenses not directly tied to the product or service you provide. Rent, utility bills, phone bills, payments for outside help like bookkeeping services, postage and most salaries (except in service businesses) are common fixed costs.
Next, let’s go to the details of the process. Begin with the first step: Estimating Your Sales/Revenue. Read on…
Step-1. Estimate Your Sales (or Revenue)
Start your break-even analysis by making your best estimate of annual sales revenues. Your estimate will obviously depend on several different variables, such as your type of business, what you plan to charge for each product or service you’ll offer and how successful you’ll be at selling products and services.
Though at first it may seem overwhelming to project revenues based upon so many untested variables, it is essential that you take the plunge and try out some numbers. Even though your estimates won’t be anywhere near 100% accurate, they’ll force you to focus and refine key elements of your business idea and may even help you spot big potholes in your plan. And besides, you need these estimates in order to move ahead with your break-even calculations, so get over it and start estimating.
One good way to estimate how much money you’ll be bringing in, is to compare your business with similar ones. Retail businesses, for example, often measure annual sales revenue per square foot of retail space. Thus, if you plan to open a fish supply store, you’ll want to find out the annual sales revenue per square foot of other fish supply shops. While direct competitors probably won’t share this information, industry trade publications almost always provide it.
Case Example (I will stick on this example for the rest of this post)
Vivian is planning to open a used bookstore in Lafayette called Vivian’s Book Store. She plans to sell mostly used books, which generally have a high profit margin, but she’ll also stock a limited selection of new books at the front of the store to attract more customers. She’ll also sell some miscellaneous trinkets like postcards and magnets.
As part of trying to figure out how much sales revenue she can realistically expect for Vivian’s Book Store, Vivian calls up a couple friends who happen to be in the book business. One who works at a nearby used bookstore confides to Vivian that the store sells approximately $450 worth of books per square foot per year. Another friend owns a new-and-used bookstore in Madison; she tells Vivian that they bring in about $400 annually per square foot.
Neither of these stores is exactly like the one Vivian envisions; the one in Lafayette doesn’t sell any new books, and the one in Madison does a healthy trade in textbooks, which Vivian doesn’t expect at her store. To round out her information, Vivian also looks into some trade publications and does a bit of sleuthing at local new-and-used bookstores, examining their prices and how busy they seem to be.
Ultimately she decides that an annual income of $350 per square foot is realistic. She has her eye on a few storefronts, all around 1,200 square feet, so she estimates her annual revenues to be $420,000.
Basing your projected revenue on the numbers of other similar companies’ is also a good estimation method for non-retail businesses such as wholesaling or manufacturing companies. However, it can be somewhat tricky finding a solid basis for comparison for non-retail businesses.
Unlike retail businesses, sales per square foot wouldn’t really apply. If you’re not already well-acquainted with your field, you’ll have to do some research. Study similar businesses with an eye for how many employees they have, how wide their distribution is and how much annual income they earn. Base your income projections on similarly sized businesses with a comparable range of distribution.
If yours is a service business, your estimate of sales revenue will depend on how many billable sales you’ll be able to make each month. A big part of doing this is to estimate how many hours you and any employees will work and how much you’ll be paid per hour by your clients. But don’t overlook the fact that all of your time won’t be billable—you won’t be providing services every hour you’re at work. For example, if you run a landscaping business, a sizable portion of your time will not be performing landscaping work but managing your accounts, maintaining your equipment and soliciting new clients. You’ll need to make a realistic assessment of how much of your time is taken up by these non-billable activities and how much time is spent on providing actual services to clients to get an accurate picture of how much money will be flowing in.
Step-2. Calculate Your Average Gross Profit Percentage
Your next task is to figure your average gross profit percentage. If you’re not an account, it may sound complex, but basically it’s just a figure that represents how much of each sales dollar will be left over after paying for the costs of the products or services themselves.
There are a number of steps involved in calculating this figure, but none involve anything more than simple math (addition, subtraction, multiplication and division). It’s definitely a number you want to figure out, as it’s a crucial piece of your breakeven puzzle. Once you know your average gross profit percentage, you’ll easily be able to figure out how much money you’ll need to bring in to cover all the costs of your business.
In a nutshell, to figure your average gross profit percentage you’ll need to:
- Figure out your gross profit for each major category of your products or services.
- Determine an average gross profit for your business overall, including all your products and services
- Divide your average gross profit by your average selling price.
In case you’re wondering what the difference is between “gross profit” and “average gross profit,” here’s a quick explanation:
When you sell an individual product, the money that you earn above the cost of the item itself (called your variable cost, or sometimes cost of goods sold accountants often abbreviated it as COGS) is called gross profit. For instance, if your pet store sells a doghouse for $200, and you bought the doghouse for $110, then what’s left over for you after the sale is $90—your gross profit. If your business sells more than one kind of product (like most), you’ll need to figure an average gross profit for your total product line in order to get a realistic picture of how much of your income will be left over after paying for all your products. For instance, the average gross profit for your pet store would include all of your products in the calculation—cat scratching posts, pet food, play toys, etc.—including their sales price, and what they cost you.
The next take you through the process of calculating your business’s average gross profit:
Figuring Your Gross Profit by Category – As described above, your gross profit is the amount of money you make on each sale, above the cost of the product or service itself (aka the variable cost, or cost of goods sold). Gross profit is determined simply by subtracting the variable cost of your product or service from its sales price. Variable costs are generally fairly easy to estimate. If you’re selling products bought from a wholesaler, your variable costs may be as simple as what you pay for the products themselves. If you’ll assemble the products, then include your costs for the parts and labor needed to put them together. Also remember to include items like packaging or freebies in your variable costs. If you only sell services, variable costs basically include the pay of whoever provides the services (you or perhaps an employee), not including time spent on administrative tasks and managing accounts, which is generally considered to be a fixed, not variable, cost. It can sometimes be tricky to figure out the variable costs of a service business. Do your best to separate out the costs that are not associated with individual projects—those are your fixed costs.
One challenge in figuring out your business’s gross profit is that your selling prices and variable costs may vary a great deal from product to product (or service to service). For instance, say you buy cat collars for an average of $4, and sell them for an average price of $10 (your gross profit per cat collar would be $6). Doghouses, on the other hand, cost you an average of $110, and you sell them for an average price of $200 (your gross profit per dog house would be $90).
To account for these differences you should categorize your products or services and figure an average gross profit for each category. There are a few steps to follow, but hang in there—each one is pretty simple:
First, estimate the average selling price and average variable cost for products or services with roughly similar selling prices and variable costs. For instance, you might group all your animal collars together—for cats, dogs and ferrets—since their selling prices ($9 to $13) and variable costs ($3 to $5) aren’t too different. Don’t lump together products or services with considerably different selling prices or variable costs. As a general rule, the more tightly you define your categories, the more accurate your estimates will be.
After you’ve estimated the average selling price and average variable cost for each category, subtract the average variable cost from the average selling price for each category, and you’ll have an average gross profit dollar figure for each category.
Animal Bird Dog
collars houses houses
Average selling price $11 $60 $200
– Average variable cost $4 $30 $110
= Average gross profit $7 $30 $90
To calculate each category’s gross profit percentage, divide the average gross profit figure by the average selling price.
Animal collars category:
Average gross profit $ 7.00
[divide] Average selling price $ 11.00
[equal] Gross profit percentage 63.6%
Using the above example, it follows that if you sold $1,500 in cat collars, 63.6% of that—$954—would be gross profit, or the amount left over after paying costs of goods sold.
Calculating Your Average Gross Profit – After you’ve found the gross profit percentage for each category, you’ll be able to determine your average gross profit for your business as a whole.
First, estimate your annual sales revenue per category. Earlier you estimated your total annual sales revenues; now divide that figure as best you can into your estimates for each category. For example, if you estimated total annual revenues of $100,000 for your pet supply business, divide that among your categories, such as collars, birdhouses and doghouses—say $25,000 in collar sales, $40,000 in birdhouses and $35,000 in doghouses. Base your division on your best sense of which categories and products will make up a big part of your business, and which will have a smaller share.
Then, for each product category, multiply the estimated sales revenue by the category’s gross profit percentage (arrived at above) to arrive at your total gross profit dollars per category.
Animal collars category:
Estimate sales revenue $25,000
x Gross profit percentage 63.6%
= Total gross dollars $15,900
Finally, add together the gross profit dollar amounts for each category to arrive at a total annual gross profit for your business. Divide the total annual gross profit figure by the total annual sales that you estimated for all products or services. The result will be an average gross profit percentage for your business.
Next, let’s look at how this process works with Vivian’s Book Store.
As you may recall, Vivian plans to sell new and used books, plus some peripheral items such as postcards and refrigerator magnets. Since the profit margins for new books, used books and trinkets are different, Vivian figures a gross profit percentage for each of these categories (Used Book, New Book, and Trinket Category).
Note: Vivian might want to establish separate categories for hardback, paperback and coffee-table books, but we’ll keep things simple.)
To accomplish this, first Vivian estimates an average variable cost for each category. In addition to the cost of the merchandise, she includes the cost of free bags, bookmarks and wrapping paper for gifts. For instance, used books cost her an average of $3, and she figures the bookmarks and bags that go with each sale will cost her an average of 10¢. So her total average variable cost in the used book category is $3.10. She doesn’t include fixed costs, like rent or salaries, here.
Next, Vivian fills in an average selling price for each product category. Her average selling price for used books, for example, is $7. She then subtracts the average variable cost (arrived at above) from the average selling price to get an average gross profit figure for each product category. Subtracting her average variable cost for used books ($3.10) from her average selling price for used books ($7.00) leaves her with an average gross profit for used books of $3.90.
Used Book category:
Average sales price $ 7.00
– Average variable cost $ 3.10
= Average gross profit $ 3.90
To determine the gross profit percentage, she’ll simply divide the gross profit by the selling price in each category to get a gross profit percentage for each category. Dividing her average gross profit for used books ($3.90) by her average selling price ($7.00) gives Vivian a gross profit percentage of 56% for used books, a good percentage!
What does that mean for Vivian? For every dollar she’ll bring in from used books, 44 cents per dollar will be eaten up on Vivian’s costs, leaving 56 cents per dollar to cover fixed costs and go towards a net profit. Her gross profit percentage for new books is 33% (=$3.90/12), and for trinkets it’s an impressive 70% (=$1.40/2).
Using the gross profit percentages and estimated sales revenues for each category, Vivian can calculate the gross profit dollar figure for each category. For example, her estimated annual sales of used books is $300,000. (Remember that Vivian estimated her total annual sales revenue to be $420,000. She thinks used books will account for a little over 2/3 of her sales.) By multiplying $300,000 by the used book category’s gross profit percentage (56%), she estimates an annual gross profit of $168,000. Adding up the gross profit figures for each category, Vivian figures that her total gross profit will be $215,000.
Finally, by dividing this amount by her annual estimated revenues of $420,000, she easily determines her total gross profit percentage, which is 51.2%. Here is how Vivian came up with the result:
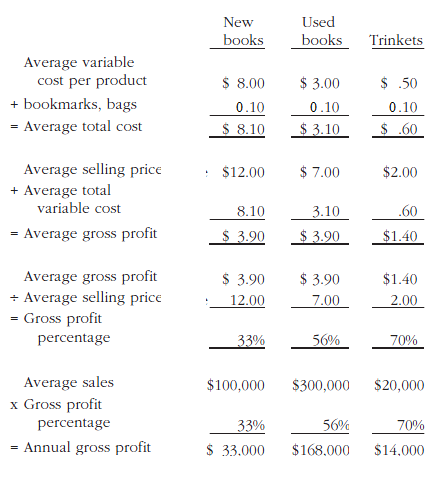
Here is how, Vivian, finally, calculate her “Annual Gross Profit”:
New Book $ 33,000
[plus] Used Books $168,000
[plus] Trinkets $ 14,000
[equal] Total annual gross profit $ 215,000
[divide] Total annual sales $ 42,000
[equal] Average gross profit percentage 51.2%
[plus] Used Books $168,000
[plus] Trinkets $ 14,000
[equal] Total annual gross profit $ 215,000
[divide] Total annual sales $ 42,000
[equal] Average gross profit percentage 51.2%
Step-3. Estimate Your Fixed Costs
You’re done with the hard part—compared to calculating your gross profit percentage, fixed costs are a breeze. Simply estimate your monthly fixed expenses, including items like rent, utility bills, office supplies, un-collectable debts—basically, any costs you expect to have independent of the product or service you sell. Since many of these costs recur monthly, it’s usually easiest to estimate them per month and total them for one year. It’s also a good idea to throw in a little extra, say 10% or so, to cover miscellaneous expenses that you can’t predict. Once you’ve arrived at a total, you’ll know that you’ll need to make at least this much gross profit (and probably a healthy chunk more) to keep your business afloat.
Example
Still with Vivian’s case, here is her list of monthly estimates for fixed costs:
Rent = $ 3,500
Wages for part-time clerks = 2,500
Telephone = 700
Office equipment = 700
Insurance = 500
Advertising = 700
Electronic payment system fees = 300
Total fixed expenses per month = 11,000
Annual total fixed expenses (monthly expenses x 12) = $132,000
Notice that Vivian has chosen not to list her salary here as an expense. She, like many sole proprietors, figures that her savings, help from friends and family, and some extra crumbs the business may produce should be enough to live on for the short term. Once she figures out how much profit the business will bring in regularly, she’ll decide how much profit she can expect to take out of the business and add it to her fixed costs.
Note: Not including payments for your own living expenses in your breakeven analysis, however, can be dangerous, at least if you’re planning to live off your business’s profits from the get-go.
If this is your plan, you should add to your fixed costs the minimum amount you’ll need to take out of the business to cover your living expenses. Then, if you can’t project your income to be higher than your fixed costs when the amount you’ll need for living expenses is included, you’ll know you can’t plan on living off the company. This may be a clue that your business is not a good bet.
Step-4. Calculate Your Break-Even Point
Once you have estimated your fixed costs above, and your average gross profit percentage (from step-2, above), it’s easy to figure out how much revenue you’ll need to break even.
Remember, your gross profit percentage represents how much of each dollar of revenue is actual profit, left over after paying for the product or service itself. To figure out your break-even point, you’ll divide your estimated annual fixed costs by your gross profit percentage. The result will be your break-even point—the amount of sales revenue you’ll need to bring in just to cover your costs.
Example
With Vivian’s Book Store, it will equal her annual fixed expenses divided by her average gross profit percentage:
Annual fixed expenses $132,000
[divide] Average gross profit percentage (51.2%)
[equal] Break-even point $257,813
If you’re having trouble understanding how this equation works, you’re not alone. Conceptually, it’s a little tricky to see how dividing your fixed costs by your gross profit percentage yields your break-even point. Think of it this way:
However much money your business brings in, some of it will be eaten up by the cost of the product or service itself (your variable costs), leaving you a reduced amount left over to pay your bills. How much is left over is determined by your gross profit percentage—this number tells you just how much will be left over, on average, from each dollar, after paying for your product or service itself (your variable costs). When you divide your estimated annual fixed costs by your gross profit percentage, the resulting number (the break-even point) is the exact amount that’s enough to cover your fixed costs.
If you’d prefer math (I am not better than you, but as an accountant I have to), here is in a linier equation:
Break-even Point is: Sales (or Revenue) – Variable Cost – Fixed Cost = 0
Recalling the concept I mentioned on the preface, it is a point where your business have made sales, haven’t make a profit, but isn’t in lost position. It’s simply “even”. That is why it’s called Break-even Point. How does that sound? Easier? Great!
Step-5. Analyze Your Break-Even Point
If your ‘estimated revenue’ exceeds your ‘break-even point’, great!—but that’s not the same thing as saying you are free to put the excess money in your pocket. Again, remember that every dollar you bring in doesn’t come for free; the cost of your product or service also has to be covered. The portion of excess sales revenue that’s really yours (ignoring taxes for the moment) is equivalent to (you guessed it) your gross profit percentage of that excess revenue. In order to determine how much of the excess revenue is pre-tax profit, multiply the excess by your gross profit percentage. The result is your estimated net profit. This last (net profit) is free if you want to put it into your pocket.
Example
Earlier, Vivian estimated her annual sales revenue to be $420,000—over $160,000 more than she needs to break even.
Estimated revenue $420,000
– Break-even point $257,813
= Excess revenues $162,187
To figure out how much of her excess revenue will be actual pre-tax profit, Vivian multiplies it by her gross profit percentage:
Excess revenues $162,187
x Gross profit percentage 51.2%
= Net profit $83,040
In this case, Vivian is happy to see her projections show a profit. But she needs to remember that none of her estimates included any payments to herself, meaning she’ll probably need to take some of that net profit just to meet her living expenses.
If, on the other hand, your break-even point is higher than your expected revenues, you’ll have some decisions to make: Whether certain aspects of your plan can be amended in order to come up with an achievable break-even point. For instance, perhaps you could find a less expensive source of supplies, do without an employee or save rent by working out of your home.
But don’t change your numbers without a very good reason. When confronted by a break-even point that exceeds your estimated revenues, you may be tempted to tweak and squish your numbers into a profitable forecast, even if those numbers aren’t realistic. Unless you really do have a good reason to think you can break even at a lower point, this is a temptation to guard against.
Two Piece of Advise from An Accountant (who is also managing his own small business):
Generally speaking, when trying to pencil out a more profitable break-even point, it’s best to focus on your costs. The most reliable way to tilt a business from the red to the black (changing from ‘under-
break-even’ to ‘profitable’ figure) is to reduce what you will pay out, not to make a more optimistic projection of what you’ll take in. That is accountants’ way of judging numbers
I know, as business people, I believe you know how to make your plan goes to taking off (I made it also). But if your purpose to calculate and analyze break-even point is for financing purpose (bank’s review), they will go conservative even worse than accountants. In addition, in my personal experience (as an accountant and new business people combined), my real cost almost always bigger than my plan. So, when doing break-even point analysis for my own business, I always estimate the cost (variable and fixed cost) bigger compare to the industry average. Good luck!
Source:
No comments:
Post a Comment
Note: Only a member of this blog may post a comment.