I have discussedhorizontal and vertical techniques to analyze a set of financial statements. Another method to analyzefinancial statement information involves the use of ratios. Financial ratios are useful in showing the relationships among financial statement data and also can be useful in comparing one company with another or analyzing the same company over time. Ratios often are classified into different categories. Within each category, the ratios measure a common element, such the company’s profitability or ability to pay its current debts. Sometimes the terminology of these different categories varies, but even with differing terms, the concepts are the same. Financial statement ratio is a powerful tool for business. Unless you know how to interpret the ratio, they are just another useless numbers.
Through this post, I will discuss the financial ratio financial ratios that commonly used to analyze the financial statement sets. A 15 pages comprehensive ratio, formula, calculation and its interpretation gathered into one post to ensure an un-paused reading. In this way, you should be able to understand the ratios in complete formation. It is illustrated with case examples that will take you into “do—it—yourself”.
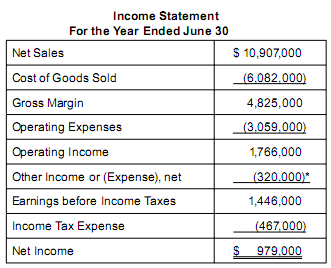
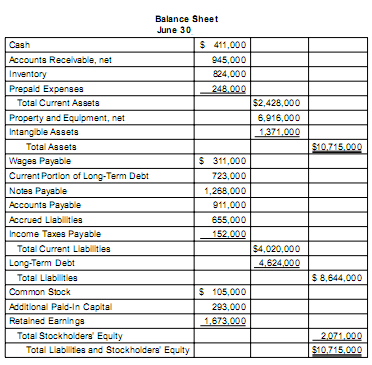
Here are income statement and balance sheet of Lie Dharma Company as an example that I will use to illustrate the ratios:
Income Statement for Ratio Analysis
Balance Sheet for Ratio Analysis
Liquidity Ratios
Debts cannot be paid with assets such as accounts receivable and buildings but must be paid with cash. Thus, ratios that help measure a company’s ability to pay its current debts as they become due often are called liquidity ratios since the term liquidity means nearness to cash. Cash is the most liquid asset a company can have; you can’t get closer to cash than having cash itself. Accounts receivable are less liquid; they will be converted into cash once the customer pays the company. Inventory is even less liquid; it must be sold first, and if it is sold on account, time must pass before the resulting account receivable is converted into cash. If a company can pay its debts when they are due, the company is said to be solvent, and so liquidity ratios sometimes are referred to as solvency ratios.
A company’s balance sheet may report that it has $1,000,000 in cash (or $10,000,000 or perhaps only $1,000). Is that enough to pay the bills that will be coming due in the near future, such as a year or less? It’s impossible to answer that question with information on only the dollar amount of cash on hand. The answer depends on the amount of current liabilities that are also on the balance sheet. Furthermore, the company may have accounts receivable or other current assets such as short-term investments that can be converted easily into cash and used to pay bills as the need arises. Thus, answering the question requires a comparison of the relationship between various amounts on the balance sheet. Useful ratios for making this comparison include the current ratio and the quick ratio.
[1]. Current Ratio
The current ratio is calculated as follows:
Current Ratio = Current Assets / Current Liabilities
Current assets are assets that will be converted into cash, sold, or used typically within a year and include assets such as cash, short-term investments, accounts receivable, interest receivable, inventory, and prepaid expenses. Note that prepaid expenses never will be converted into cash but will be expensed or used up within a year. Current liabilities are the debts that will be paid or settled within a year by providing goods or services and include items such as accounts payable, the portion of any long-term debt (such as a mortgage) that is due typically within a year, interest payable, wages payable, taxes payable, accrued liabilities, and unearned revenues.
The current ratio for Ratio Analysis Lie Dharma Company is computed as follows:
Current Ratio = Current Assets / Current Liabilities
= $2,428,000 / $4,020,000
= 0.60 to 1
The Interpretation:
This computation means that for every $1 of debts that will become due within a year, the company currently has 60 cents of assets that will be converted into cash or used up within the year with which to pay those debts.
There are no hard and fast rules about the range in which any ratio should fall; one wants to consider a variety of factors rather than any single ratio. However, a current ratio of at least 1.0 implies exactly enough current assets with which to pay the debts that will come due in a year, with no cushion. Even then, the composition of the current assets is important because if a significant portion consists of prepaid expenses, those expenses will not be converted into cash to pay the bills.
It is not unusual for banks, when writing loan agreements for a business, to include requirements that must be met or the loan will be due back in full immediately. Often the requirements state that certain minimum ratios must be maintained, such as a current ratio of 2.0 or 3.0, to help ensure continued liquidity but also allow a cushion.
Does this imply that the higher a current ratio, the better?
To an extent; however, if the current ratio becomes too high, that also can be cause for concern. Perhaps a company is keeping too much of its assets in liquid form when possibly the organization could become more profitable if, for example, the assets instead were placed in long-term investments and/or used to purchase additional fixed assets by which the company could increase operating activities.
[2]. Quick Ratio
The quick ratio (sometimes called the acid test ratio) is a more conservative liquidity measure. It gets its name from the fact that the numerator contains the assets that can be turned into cash most quickly.
The formula is:
Quick Ratio = (Cash + Short-Term Investments + Receivables) / Current Liabilities
In other words, inventory and prepaid expenses are removed from the current assets total so that the most liquid current assets remain in the numerator. For this reason, creditors often consider this ratio more meaningful than the current ratio.
Why are inventory and prepaid expenses removed?
Inventory is slower to convert to cash: It first must be sold, and if it is sold on credit, the receivable must be collected, all of which will take some time. Further, some of the inventory may be obsolete or otherwise difficult to sell. Also, prepaid expenses will not be converted into cash; these are expenses, such as advertising or rent, which the company has paid for in advance.
As time passes and the benefits of the payments are received (e.g., the advertising services), the company will follow the matching principle and gradually write off the prepaid expenses from the balance sheet to an expense on the income statement.
For our Lie Dharma Company, the quick ratio is computed as follows:
Quick Ratio = ($411,000 + $945,000) / $4,020,000
= 0.34 to 1
The Interpretation:
Quick ratio that is much smaller than a current ratio indicates that the company has quite a bit of resources tied up in inventory and/or prepaid expenses. Conversely, when the two ratios are close to equal, it indicates that the company does not have much inventory and/or prepaid expenses. In Ratio Analysis Lie Dharma Company’s case, the quick ratio indicates that there is only 34 cents available for every $1 of debts that are soon to be due. Before pushing the panic button, one would want to look at recent previous years of the company and also read management’s discussion and analysis, which also is contained in the annual report to shareholders.
Profitability Ratios
Profitability Ratios
Profitability ratios measure a company’s success (or failure) in earning a profit. Recall that profit exists when revenues exceed expenses. Profitability ratios are not the same as liquidity ratios because a company can be profitable but have liquidity problems.
How can this be the case?
Perhaps a company has made many credit sales rather than cash sales, and so the revenue is recorded and profits have increased. But perhaps many customers have not paid what they owe the company, and so the cash hasn’t flowed in yet. Bills cannot be paid with accounts receivable but must be paid with cash. Thus, it is possible for a company to be profitable and insolvent at the same time.
Liquidity ratios are important for a company’s short-term success (how long can a company stay in business if it cannot pay its bills when they are due?). Profitability ratios are important for a company’s long-term success (how long can a company stay in business if its expenses exceed its revenues on a continuous basis?).
Profitability ratios compute the relationship between profit and some other financial statement item, such as assets, sales, equity, or shares of common stock out-standing. The more common Profitability ratios include the following:
- Gross margin on sales
- Profit margin on sales (return on sales)
- Return on assets
- Return on equity
- Earnings per share
- Dividend payout ratio
- Price-earnings ratio
Let’s go to the details. Read on…
[1]. Gross Margin On Sales
Gross margin (also called gross profit) is the excess of sales revenue over the cost of goods sold. Thus, gross margin represents the amount of sales revenue left, after covering the cost of the product sold, to pay all remaining business expenses and have some profit left over. Gross margin ratios vary widely from industry to industry.
In the Ratio Analysis Lie Dharma Company case, the gross margin on sales is computed as follows:
Gross Margin on Sales = Gross Margin / Net Sales
= $4,825,000 / $10,907,000
= 44%
The Interpretation:
This computation indicates that for every dollar in net sales that the company generates, the product sold cost 56 cents and there is 44 cents left to cover all remaining expenses and, the company hopes, constitute a profit.
[2]. Profit Margin On Sales [Return On Sales = ROS]
Profit margin on sales takes the bottom line (net income or net profit) after all expenses are subtracted from revenues and compares it with net sales revenue. Again, this can vary widely from industry to industry.
This ratio sometimes is called “Return On Sales [ROS]“ and is computed as follows:
Profit Margin on Sales [Return On Sales] = Net Income / Net Sales
For the company, the return on sales is computed as follows:
Profit Margin on Sales = $979,000 / $10,907,000 = 9%
The Interpretation:
Thus, for every dollar in sales revenue, 9 cents remains for bottom-line profit and 91 cents is spent on goods sold and all other expenses.
[3]. Return On Assets [ROA]
The return on assets (ROA) ratio measures how effectively management is using its assets to generate a profit.
It is computed as follows:
Return on Assets = Net Income / Average Total Assets
For the Ratio Analysis Lie Dharma Company (using year-end assets for simplicity), the return on assets is:
Return on Assets = $979,000 / $10,715,000 = 9.1%
The Interpretation:
This ratio is interpreted to mean that for every dollar invested in assets, the company earned 9.1 cents.
Is 9.1 percent an adequate return on the investment the company has made in its assets?
Comparison to the return on assets over time for this company, to competitors, and to the industry average would be useful. It should at least exceed the return that could be earned by investing in low-risk investments; otherwise it might make more sense for the company to cease doing business and instead invest in these alternatives (and earn a higher return).
[4]. Return On Equity [ROE] or Return On Investment [ROI]
The return on equity (ROE) ratio measures how well management is maximizing the return on the stockholders’ (owners’) investment in the business. For this reason, the ratio sometimes is referred to as “return on investment“.
It is computed as follows:
Return on Equity [ROE] = Net Income / Average Stockholder’s Equity
For the Ratio Analysis Lie Dharma Company (using year-end stockholders equity for simplicity), the return on equity is:
Return on Equity = $979,000 / $2,071,000 = 47.3%
The Interpretation:
This computation indicates that for every dollar the stockholders have invested in the company, 47.3 cents was earned this year; that is a fairly impressive return. However, as with all ratios and other types of analysis, one will want to consider other benchmarks. Furthermore, risk is an important consideration. “Higher risk, higher reward” is not a cliché/ If an investment in a particular company presents a greater risk, the higher degree of uncertainty should be rewarded with a greater potential return.
[5]. Earnings Per Share [EPS]
Earnings per share (EPS) was discussed briefly in Chapter 3 in the analysis of the income statement. It represents a measure of the earnings associated with a single share of stock.
This ratio is unique in that under generally accepted accounting principles require that it be presented by public companies on their income statements; no other ratios are required to be reported. Many investors and creditors track EPS closely; consequently, management also pays it close attention because it is a highly visible profit-ability number and can affect a company’s stock price.
The formula for basic (or simple) EPS is:
Basic EPS = Net Income – Preferred Dividends / Weighted Average Number of Shares Outstanding
Preferred stock is a different type of ownership interest from that represented by common stock and nearly always involves a preference in regard to dividends (a fixed amount of dividends must be paid to the preferred stockholders each year; further, the preferred stockholders are first in line to receive dividends, and so common stockholders receive nothing until the preferred stockholders are paid).
Dividends are not an expense or a cost of doing business but a distribution of the profits of the business to its owners. Since they are not an expense, they are not reported on the income statement. Therefore, subtracting dividends from net income does not double-count the dividends. Instead, with this deduction, the numerator in the formula above represents the year’s net income that is available to the common stockholders. Some corporations may have no preferred stock outstanding, in which case the numerator is simply net income.
The denominator represents the number of shares of common stock outstanding during the year, weighted by the period of time in which the shares were outstanding. Outstanding means the shares are owned by the common stockholders; the shares have been issued to the stockholders, and they hold the shares. These shares must be weighted by the period in which they were outstanding; otherwise, the resulting EPS number will be distorted.
For example: if a company reported net income of $1,000,000 for the year (but had no preferred stock outstanding) and had 1,000,000 shares of common stock outstanding as of year-end, it appears the EPS would be $1.00. But what if 750,000 shares were issued on the last day of the fiscal year? In that case, only 250,000 shares were outstanding during the year, and so the EPS would be a more impressive $4.00 ($1,000,000 / 250,000). The capital (money) that was generated by selling the remaining 750,000 shares was not available throughout the year for the company to use to generate profits, and so those shares should be weighted accordingly (in this case, with less than a day left in the year, not weighted at all).
For the Ratio Analysis Lie Dharma Company, assume that the par value of the common stock is 25 cents per share. With $105,000 reported on the balance sheet as the amount of common stock issued, this translates to $105,000 / $0.25, or 420,000 shares. Assume that these shares were outstanding since the beginning of the year, therefore, no weighting by period of time outstanding is required.
Thus, basic EPS is computed as follows:
$979,000 / 420,000 = $2.33
Since the balance sheet does not report any preferred stock outstanding, there cannot be any preferred dividends to subtract from the net income in the numerator. If the Lie Dharma Company had any potentially dilutive securities present, the company also must report a second type of EPS/ diluted EPS.
Examples of potentially dilutive securities include bonds or preferred stock shares issued that give the holder the choice of converting the bonds or shares into a pre-established number of shares of common stock. Stock options are also potentially dilutive and often are given to employees as a form of additional compensation. Options give the employee the choice to purchase a set number of shares of stock at a pre-established price and can result in considerable compensation to the employee when the market price is above the pre-established purchase price.
Diluted EPS takes into consideration how these additional securities can reduce the reported EPS number, primarily through the increased number of common shares outstanding in the denominator, even though the securities have not been exchanged for shares of common stock. The computation is more complex than that for basic EPS and typically is covered in more advanced courses in financial accounting. If a company has dilutive securities, that company is required under generally accepted accounting principles (GAAP) to present dilutive EPS along with basic EPS on the income statement. Since the Lie Dharma Company does not have any convertible bonds, convertible preferred stock, or stock options issued, no dilutive EPS computation is required.
[6]. Dividend Payout Ratio
The dividend payout ratio is often of interest to investors because it indicates how much of a company’s wealth is distributed to the common stockholders. Preferred stockholders typically have a fixed, stated amount that will be received as dividends each year, and so this ratio is calculated for the common stockholders as follows:
Dividend Payout Ratio =
Cash Dividends Paid to Common Stockholders / [Net Income – Preferred Dividends]
The denominator represents the net income available to common stockholders.
In the Ratio Analysis Lie Dharma Company, recall that there is no preferred stock outstanding per the balance sheet. The dividends paid during the year to the common stockholders would appear on the statement of stockholders’ equity, and if the dividends were all paid in cash during the year (rather than declared but not yet paid), they also will appear as a cash outlay on the statement of cash flows.
I did not present either of those two statements for the Lie Dharma Company, and so if we assume that $450,000 was paid during the year to the common stockholders, the dividend payout ratio becomes:
$450,000 / $979,000 = 46%
Once a company begins to distribute dividends, investors often expect to receive them consistently. Further, some investors will expect a relatively high payout ratio to receive what they consider an acceptable return on their investment.
[7]. Price-Earnings Ratio [PE Ratio]
The price-earnings ratio (PE ratio) is computed as its name implies:
PE Ratio = Market Price per Share of Common Stock / Earnings per Share
This ratio gives readers an idea how much the earnings of the company cost an investor who wishes to purchase shares of the company’s stock. The market price tells the investor the cost of a share but by itself does not give the investor an idea of the quality of that purchase.
Is the price reasonable considering the profitability of the company?
In the Ratio Analysis Lie Dharma Company case, assume that the current market price per share of common stock is $42. The PE ratio is computed as follows:
$42 / $2.33 = 18 times
The Interpretation:
This result means that investors are paying 18 times the current earnings to purchase a share of stock.
Is this reasonable?
As with all ratios, one will want to compare this to other benchmarks, such as the PE ratio of competitors and the industry average. There is no single benchmark for what a PE ratio “should” be, and the rules of thumb have changed over time.
Asset Management Ratios
Asset Management Ratios
Asset management ratios (also called turnover, efficiency, and sometimes activity ratios) indicate the company’s effectiveness at using its various assets. The asset management ratios we will discuss here are the following:
- Days sales outstanding
- Accounts receivable turnover
- Inventory turnover
- Days inventory supply
- Asset turnover
[1]. Days Sales Outstanding [DSO]
This ratio calculates the number of days it takes the company to collect its accounts receivables on average. The lower this number is, the better, because a company cannot pay its bills with receivables, only with cash.
The formula is as follows:
Days Sales Outstanding = Accounts Receivable x 365 / Net Sales
For the Ratio Analysis Lie Dharma Company, the days sales outstanding (sometimes called days of accounts receivable, receivable days, or average collection period) is:
($945,000 x 365) / $10,907,000 = 31.6 days
The Interpretation:
This calculation gives you an idea of how liquid the receivables are. Recall that we are including accounts receivable in the current ratio and quick ratio computations, and so if we consider the accounts receivable to be liquid, it is useful to have an idea of exactly how liquid they are.
[2]. Accounts Receivable Turnover
The accounts receivable turnover ratio is closely related to the days sales outstanding. Instead of computing the average number of days that accounts receivable are outstanding, this ratio calculates the number of times accounts receivable are collected during the year. In the example above, we calculated the days sales to be 31.6; since there are 365 days in a year, this translates to the receivables turning over about 11.5 times a year (365 / 31.6). In other words, it measures the number of times on average the company collects its accounts receivable during the year.
The formula for accounts receivable turnover is:
Accounts Receivable Turnover = Net Sales / Average Accounts Receivable
When computing receivables turnover, there are some important things that should be considered:
- First, if a significant amount of the net sales consists of cash sales, those sales should be excluded since they never result in accounts receivable (assuming the reader can gather this information from the financial statements). Often, the reader will not be able to obtain this information. However, if the proportion of cash and credit sales remains fairly constant, the ratio will not be affected by using total net sales.
- Second, since the balance sheet shows account balances at a point in time, simply using the end of year (balance sheet) amount for accounts receivable in the denominator could lead to a distorted result if the ending balance is not representative of the typical balance.
A more representative result can be obtained by using an average accounts receivable balance, which is calculated as follows:
Average Accounts Receivable = (Beginning Receivables + Ending Receivables) / 2
Thus, as with all ratio analysis, the reader will not want to rely on any single measure or even a handful. The more pieces of the puzzle one looks at, the better the overall resulting picture will be.
[3]. Inventory Turnover
This ratio indicates how quickly on average inventory is sold (i.e., turns over). How long does inventory sit on shelves before it is sold?
The formula is:
Inventory Turnover = Cost of Goods Sold / Average Inventory
Note that the denominator consists of average inventory, and not year-end inventory for reasons similar to those we discussed for receivables turnover above.
For the Ratio Analysis Lie Dharma Company (assuming that beginning inventory as determined from the previous year’s balance sheet is $717,000), the inventory turnover is:
$6,082,000 / [(717,000 + 824,000)/2] = 7.9 times
The Interpretation:
Thus, inventory was sold and replaced 7.9 times that year. Inventory turnover and its variation—days inventory supply, which is discussed next—are an indication of the liquidity of inventory.
[4]. Days Inventory Supply
A variation of inventory turnover is days inventory supply, which is a measure of the average number of days sales for which the company has inventory available.
It is calculated as follows:
Days Inventory Supply = (Average Inventory x 365) / Cost of Goods Sold
For the Ratio Analysis Lie Dharma Company, days inventory supply is calculated as follows:
([($717,000 + $824,000)/2] x 365) / $6,082,000 = 46.2 days
If we’ve already calculated the inventory turnover, the days inventory supply for the year is more easily calculated this way:
365 / Inventory Turnover = 365 / 7.9 times = 46.2 days
The Interpretation:
This calculation indicates that if we stop purchasing inventory, we have enough still on hand to maintain sales for about 46 days.
Is this sufficient?
As was indicated earlier, it depends on the industry. If the company sells jewelry or other expensive luxury items, the days inventory supply of 46 suggests that business is good and the product is moving quickly. However, if the company sells fresh fruit or other perishable items, the days inventory supply of 46 suggests that business is sluggish. Thus, inventory turnover and its variation days supply of inventory are useful in determining whether a company is carrying too much inventory, which can be caused by poor inventory management or sluggish sales.
If a company is carrying too much inventory, it may mean that the inventory is becoming obsolete, and the company will not be able to sell the inventory without reducing prices. Too much inventory also strains a company’s resources, as it represents a use of cash and can lead to additional storage and display costs. However, if a company is carrying too little inventory, that can indicate a problem in production or purchasing. Further, the company may not be able to meet customer demand and as a result could lose sales now and in the future.
[5]. Asset Turnover
The asset turnover ratio is computed as follows:
Asset Turnover = Net Sales / Average Total Assets
Average total assets is computed as follows:
Average Total Assets = (Beginning Total Assets + Ending Total Assets) / 2
The beginning total assets will be the total assets shown on the prior year’s balance sheet, since last year’s ending balance equals this year’s beginning balance. Since all assets are included in the computation, this is a more general indication of how efficiently a company uses its assets to generate sales. Specifically, it indicates how many dollars of sales are produced for every dollar invested in assets.
For the Ratio Analysis Lie Dharma Company, the asset turnover (assuming beginning total assets equals $10,575,000) is:
$10,907,000 / [($10,575,000 + $10,715,000)/2] = 1.02 times
The Interpretation:
This calculation indicates that the company generated $1.02 in sales in the year for every $1.00 it invested in assets. Whether this is an acceptable amount again depends on the industry as this ratio can vary widely from one industry to another. Generally, a company with a low asset turnover needs more capital (whether from stockholders or from creditors) to generate additional sales. In contrast, a company with a higher asset turnover can generate additional sales with a smaller influx of capital.
Leverage Ratios [or Coverage or Capital Structure Ratio]
Leverage Ratios [or Coverage or Capital Structure Ratio]
Leverage ratios (sometimes called coverage or capital structure ratios) measure a company’s long-term ability to pay its debts as they become due. Leveraging means using other people’s money to generate profit for a company. The leverage ratios we will introduce are:
- Debt-to-equity ratio
- Debt ratio
- Times interest earned
[1]. Debt-To-Equity Ratio
The debt-to-equity ratio, as the name implies, is computed as follows:
Debt-to-Equity Ratio = Total Liabilities / Total Stockholder’s Equity
This ratio calculates how much debt a company has in relation to its owners’ equity. If the ratio is 1.0, the company has exactly the same amount of debt as it has owner’s equity. With a ratio greater than 1, the company has more debt than owners’ equity; in other words, the company owes more than it owns. The higher the ratio becomes, the more heavily burdened with debt the company is. Creditors often prefer that this ratio be low because it suggests that the company is less likely to default as it can pay back its loan with the owners’ investments if necessary. Usually if the ratio is low, it indicates that there is greater long-term financial safety and more flexibility: to borrow in the future, if necessary. (In fact, these leverage ratios sometimes are referred to as safety ratios.)
For the Ratio Analysis Lie Dharma Company, the debt-to-equity ratio is:
$8,644,000 / $2,071,000 = 4.2 times
The Interpretation:
This computation indicates that the company has about 4.2 times as much debt as equity. Thus, the company owes much more to others than the stockholders own. You probably can anticipate our next statement: This computation is more meaningful when compared with a benchmark such as the industry average, a particular competitor, and/or this company over time. Further, no single ratio will paint a complete picture.
[2]. Debt Ratio
The debt ratio measures the amount of debt in relation to the total assets of the company. Assets came from somewhere: either from outsiders (what you owe) or from owners (what you own).
The debt ratio is computed as follows:
Debt Ratio = Total Liabilities / Total Assets
For the Ratio Analysis Lie Dharma Company, the debt ratio is:
$8,644,000 / $10,715,000 = 0.80 or 80%
The Interpretation:
This computation indicates that about 80 percent of the company’s assets are financed by creditors. The higher this ratio is, the greater is the risk that the company may have trouble meeting its debt obligations.
[3]. Times Interest Earned
Interest must be paid on debt and it must be paid on time or the company risks having its creditors call in the loan. To get an indication of a company’s ability to pay the annual interest it owes, times interest earned can be calculated.
The formula is as follows:
Times Interest Earned = Income before Interest Expense and Taxes / Interest Expense
Note that the bottom-line net income figure is not used in the numerator, since that already has interest expense deducted. Thus, using the net income figure would distort the computation of the company’s ability to pay the interest it owes. Since income taxes are based on income after all expenses, using income before taxes as well helps one compute a more meaningful ratio.
For the Ratio Analysis Lie Dharma Company, times interest earned is computed as follows:
Times Interest Earned = $1,753,000 / $307,000 = 5.7 times
The numerator, income before interest and taxes, was computed as follows:
Earnings before Income Taxes = $1,446,000
Add back Interest Expense = $ 307,000
Income before Interest and Taxes = $1,753,000
The Interpretation:
Thus, for this period the company earned 5.7 times what it had to pay in interest. Although there is no single benchmark above which this ratio should be, one hopes the ratio will be greater than 1. Otherwise, the company is earning exactly what it must pay for interest, and that probably will cause concern among the lenders.
Source:
No comments:
Post a Comment
Note: Only a member of this blog may post a comment.